Jeff Bezos’ Blue Origin will launch six people to suborbital space on Saturday (June 21), and you can watch the action live.
Category: 未分类
-
Orbiter Pair Expands View of Martian Ionosphere

Source: Journal of Geophysical Research: Planets
Like Earth, Mars is surrounded by an ionosphere—the part of its upper atmosphere where radiation from the Sun knocks electrons off of atoms and molecules, creating charged particles. The Martian ionosphere is complex and continuously changes over the course of the day, but its role in atmospheric dynamics and radio communication signals means understanding it is key for Mars exploration.
One way to study the Martian ionosphere is with radio occultation, in which a spacecraft orbiting Mars sends a radio signal to a receiver on Earth. When it skims across the Martian ionosphere, the signal bends slightly. Researchers can measure this refraction to learn about Martian ionospheric properties such as electron density and temperature. However, the relative positions of Mars, Earth, and the Sun mean conventional radio occultation cannot measure the middle of the Martian day.
Now, Parrot et al. deepen our understanding of the Martian ionosphere using an approach called mutual radio occultation, in which the radio signal is sent not from an orbiter to Earth but between two Mars orbiters. As one orbiter rises or sets behind Mars from the other’s perspective, the signal passes through the ionosphere and refracts according to the ionosphere’s properties.
The researchers analyzed 71 mutual radio occultation measurements between two European Space Agency satellites orbiting Mars: Mars Express and the ExoMars Trace Gas Orbiter. Thirty-five of these measurements were taken closer to midday than was ever previously achievable, in effect allowing scientists to see a new part of the Martian ionosphere.
The new data enabled the research team to calculate how the ionosphere’s electron density changes throughout the day. They were also able to learn more about how the altitudes of the upper and lower layers of the ionosphere—called M2 and M1, respectively—vary daily. The new data suggest that the peak electron density of the M2 layer changes less dramatically during the day than has been suggested by prior research. The data also show that the M1 does, indeed, still exist during the midday, contradicting previous assumptions.
The researchers also used the new data to calculate ionospheric temperatures. They found that instead of being hottest at midday, temperatures in the ionosphere rise as the Sun reaches Martian sunset. Simulations using a Mars climate model suggest that it is likely winds transporting air, rather than the Sun’s direct heat, that control these temperature dynamics. (Journal of Geophysical Research: Planets, https://doi.org/10.1029/2024JE008854, 2025)
—Sarah Stanley, Science Writer

Citation: Stanley, S. (2025), Orbiter pair expands view of Martian ionosphere, Eos, 106, https://doi.org/10.1029/2025EO250228. Published on 20 June 2025.
Text © 2025. AGU. CC BY-NC-ND 3.0
Except where otherwise noted, images are subject to copyright. Any reuse without express permission from the copyright owner is prohibited. -
A Coral Core Archive Designed for Transparency and Accessibility

Coral reefs are vital ecosystems supporting marine life, ecotourism, and coastal protection. They also hold something valuable under their surface: records of the ocean’s past. Beneath the living outer layer of massive corals are dense, rocklike skeletal structures containing annual bands, similar to tree rings. Scientists can study the conditions at the time these bands formed by drilling, retrieving, and analyzing cores, some of which represent centuries of coral growth.

Daren Coker (left) and Thomas DeCarlo drill for a coral core in the Red Sea. Credit: Morgan Bennett-Smith Since the 1970s, studies of coral cores to determine past growth patterns, a field known as coral sclerochronology, have produced notable scientific discoveries. Knutson et al. [1972] found that annual bands comprise alternating high- and low-density bands that reflect seasonal growth patterns. Hudson [1981] found that typically, high-density bands form during slower winter growth and low-density bands form during faster summer growth and that long-term coral growth variations are influenced by water quality and the effects of coastal development. Some cores also contain high-density “stress bands” formed because of coral bleaching events or other environmental challenges [Lough, 2008]. Together, this banding provides insights into coral growth history, enabling scientists to construct reliable age models of past oceanic and climatic conditions.
Today, methods used to investigate coral cores have advanced considerably. Alongside other methods such as stable isotope and elemental ratio analyses, computed tomography (CT) scanning plays a major role in yielding data that help to reveal coral growth parameters. Scientists can use 2D X-ray and 3D CT scanning to examine the internal structure of coral cores, including their annual density bands [Knutson et al., 1972; Hudson, 1981; Lough, 2008; DeCarlo et al., 2025]. In some cases, such analysis even involves a scientist visiting a local hospital to use its CT machine—an unexpected patient for the radiology technician.

This animation of a CT scan shows a cross section of a coral core. The small circles within the core are corallites, the individual skeletal structures formed by coral polyps. Credit: USGS, Public Domain 
A coral core sits on the exam table of a CT machine at a hospital before being scanned. Credit: Thomas DeCarlo However, there has been no systematic archiving of coral core imagery data, partly because of the lack of a suitable repository. This gap presents risks of losing valuable images and prevents streamlined, transparent sharing of scientific interpretations from these images. Therefore, a centralized, virtual, open-access repository of coral core imagery is crucial for fostering transparent science and preserving these resources for future research.
An App for Organizing an Archive
The CoralCT application was developed to consolidate and organize coral core scans in a virtual repository that enables digital archiving and image analysis [DeCarlo et al., 2025]. The repository currently contains scans of more than 1,000 cores collected from a wide range of coral reef regions, including the Great Barrier Reef, the Caribbean, and the Red Sea. These core scans have been contributed by individuals and agencies, including the U.S. Geological Survey (USGS) and NOAA.
Coral researchers upload X-ray or CT scans to CoralCT and, when they are ready, can make their data publicly available to anyone with a computer and internet connection. This approach to transparency fosters collaborations among coral core researchers, who can view the app’s core directory and see who else has collected cores from their areas of interest. It also helps avoid unnecessary duplication of research efforts, which is especially important given the need to reduce sampling impacts on corals, many of which are endangered species.
Using the application’s analytical tools, observers can map annual density bands in coral cores to extract data on growth rates and skeletal density. As in tree ring studies, this sort of analysis offers insights into past environmental conditions because coral growth can respond sensitively to climate variability.
For example, Barkley et al. [2018] used CoralCT to visualize high-density stress bands and reconstruct the history of coral bleaching over 6 decades on a remote reef in the equatorial Pacific Ocean where monitoring data were sparse. Rodgers et al. [2021] measured annual growth rates in CoralCT to track the recovery of corals off Kaua‘i, Hawaii, in the 15 years after a damaging flood event. More recently, DeCarlo et al. [2024] leveraged the breadth of cores in CoralCT to reconstruct coral growth trends over recent decades to centuries across thousands of kilometers of the Indo-Pacific.
Rescuing Old Records and Gathering New Ones
Archiving valuable data that might otherwise be lost is a foundational purpose of CoralCT. A standout example of how it’s serving this purpose involves the rescue and digitization of X-ray images of more than 20 cores collected across the Pacific Ocean between the 1980s and early 2000s. The X-ray films, previously stored by a retiring scientist, are now archived and available for analysis on CoralCT.
Older collections like these can provide valuable insights into coral growth before environmental disturbances, such as mass bleaching from heat stress, began to affect them.
In a similar effort, USGS recently CT scanned coral cores dating back to the late 1960s, some of the earliest cores ever collected [Hudson et al., 1976]. These scans are being added to the repository so they can be reanalyzed by researchers now and into the future. Older collections like these can provide valuable insights into coral growth before environmental disturbances, such as mass bleaching from heat stress, began to affect them.
Alongside these historical contributions, CoralCT’s repository continues to grow with the addition of new data. One such recent contribution includes scans of reef cores collected from offshore Hawai‘i in 2023 during the International Ocean Discovery Program’s Expedition 389. Reef cores differ from coral cores in composition and structure but are also critical for understanding ocean history and environmental change. During Expedition 389, cores were collected from drowned reefs that once grew near the ocean surface but stopped calcifying as they were submerged in deeper water. These reef cores contain fragmented coral, coralline algae, microbialites, and other reef-building materials whose compositions enable scientists to look millennia into the past and uncover valuable records of sea level and climate change.
Repeatable Analyses, Verifiable Results
When raw, unprocessed coral core images are not archived, the value of growth measurements and other analyses is limited because other scientists cannot readily and independently verify them. This is problematic because science fundamentally relies on the ability to repeat experiments and verify results, especially considering individual researchers can introduce subjectivity and potential biases into even highly systematic and rigorous interpretations of data. As datasets grow larger, more intricate, and more numerous, maintaining transparency is increasingly important but also increasingly difficult.

In this screenshot of a coral core being analyzed in the CoralCT application, the orange lines on the core image indicate where an observer has mapped the annual density bands. Credit: Avi Strange CoralCT addresses these challenges by ensuring that all information and context about a core is fully documented, accessible, and downloadable. This information includes essential metadata such as the core’s origin, ownership details, collection date, depth, and species identifications. Most important, CoralCT archives the user-defined maps of annual banding used to derive growth rate data [DeCarlo et al., 2025], ensuring that these data and interpretations are fully reproducible and open to verification by others.
This transparency is also shared among observers within the application. When a user is mapping the bands of a core, they can add notes and screenshots that other users can view when they’re analyzing that core. Furthermore, when a user finishes mapping the bands of a core and processes the data, this information is saved and made downloadable for other scientists to view. This ability enables scientists to conduct multiobserver studies, which can reduce potential biases introduced by individual observation.
A challenge encountered in our efforts to broaden CoralCT has been the hesitancy of some researchers and programs to share data.
Despite these advantages, a challenge encountered in our efforts to broaden CoralCT has been the hesitancy of some researchers and programs to share data because of concerns about intellectual property infringements and the “scooping” of prepublication data. This hesitancy, which is understandable considering the lack of transparency and protections for data owners in prior data management practices, can unfortunately limit scientific advancements and collaborations that might help address climate change, coral reef degradation, and other complex challenges.
To address these concerns, CoralCT offers privacy controls to core owners that they can use to restrict access to their scans and the derived output data. These controls are particularly useful when cores are part of ongoing research that has not yet been published or are subject to a postcruise moratorium, ensuring that sensitive data remain protected until the research is ready to be shared. In addition, each core is tagged with a data owner, acknowledgments, and relevant citations.
Advancing Accessibility and Collaboration
CoralCT also represents a path to making science more inclusive and accessible. The application is designed with an easy-to-use interface and includes resources such as video tutorials and a step-by-step user guide to help introduce its features to a wide audience. K–12 lesson plans that guide students through mapping coral core bands in the app were also recently created, offering approachable ways to explore marine science.

A middle school student visiting the Sclerochronology Lab at Tulane University uses a virtual reality headset to interact with coral cores in 3D during the university’s 2025 Boys at Tulane in STEM event. Credit: Danielle Scanlon 
Middle school students learn about coral cores from a hologram at a workshop at Hawai‘i Pacific University. Credit: Thomas DeCarlo The app’s educational potential was demonstrated during recent outreach events. Using virtual reality technology, middle school students in New Orleans viewed 3D coral core scans from CoralCT and practiced identifying annual density bands. At a similar event, sixth grade students in Hawaii interacted with 3D holographic coral cores, learning how scientists retrieve and study them to understand growth patterns over time. The positive experiences of students and teachers during these events demonstrated how CoralCT provides an opportunity to engage hands-on with real scientific data.
Integration of AI could also, importantly, make it easier for all users to contribute to coral core analysis, regardless of their academic background or field experience.
Looking forward, there is potential to integrate artificial intelligence (AI) into CoralCT for automated identification of coral banding patterns. If an AI system were trained on existing human interpretations, it could automatically suggest band markings that users could review and verify. This advancement offers the potential for more accurate and efficient coral core analyses while maintaining human oversight. Integration of AI could also, importantly, make it easier for all users to contribute to coral core analysis, regardless of their academic background or field experience. Each new contribution or analysis of a core enhances the CoralCT database and extends our knowledge of coral reefs and past ocean conditions.
Coral sclerochronology is vital for understanding environmental changes in coral reef ecosystems and the impacts these changes have wrought. Through this research, we gain insights into the ocean’s past and advance our understanding of coral reefs today. As threats to reefs intensify, large open-access datasets are increasingly essential for monitoring reef health and predicting future impacts.
CoralCT thus plays an important role in preserving valuable records of coral growth and environmental history while promoting collaborative, accessible, and transparent data sharing. In making coral reef science available to researchers and the public alike, it is connecting data, ideas, and people to address critical questions about our changing world.
Acknowledgments
CoralCT was developed with support from National Science Foundation award OCE-2444864. Any use of trade, firm, or product names is for descriptive purposes only and does not imply endorsement by the U.S. government. We thank the IODP 389 Expedition Science Party, ECORD Science Operator (ESO) support staff, benthic drilling team, MMA surveyors, and the captain and crew of the MMA Valour. International Ocean Discovery Program (IODP) Expedition 389 was supported by funding from the various national funding agencies of the participating IODP countries. We also thank all data contributors to date, including Giulia Braz, Jessica Carilli, Leticia Cavole, Ben Chomitz, Travis Courtney, Ian Enochs, Thomas Felis, Ke Lin, Malcolm McCulloch, Haojia Ren, Riccardo Rodolfo-Metalpa, Natan Pereira, and the U.S. Geological Survey Coastal and Marine Hazards Resources Program.
References
Barkley, H. C., et al. (2018), Repeat bleaching of a central Pacific coral reef over the past six decades (1960–2016), Commun. Biol., 1, 177, https://doi.org/10.1038/s42003-018-0183-7.
DeCarlo, T. M., et al. (2024), Calcification trends in long-lived corals across the Indo-Pacific during the industrial era, Commun. Earth Environ., 5, 756, https://doi.org/10.1038/s43247-024-01904-8.
DeCarlo, T. M., et al. (2025), CoralCT: A platform for transparent and collaborative analyses of growth parameters in coral skeletal cores, Limnol. Oceanogr. Methods, 23(2), 97–116, https://doi.org/10.1002/lom3.10661.
Hudson, J. H. (1981), Growth rates in Montastraea annularis: A record of environmental change in Key Largo Coral Reef Marine Sanctuary, Florida, Bull. Mar. Sci., 31(2), 444–459, www.ingentaconnect.com/content/umrsmas/bullmar/1981/00000031/00000002/art00014.
Hudson, J. H., et al. (1976), Sclerochronology: A tool for interpreting past environments, Geology, 4(6), 361–364, https://doi.org/10.1130/0091-7613(1976)4<361:SATFIP>2.0.CO;2.
Knutson, D. W., et al. (1972), Coral chronometers: Seasonal growth bands in reef corals, Science, 177(4045), 270–272, https://doi.org/10.1126/science.177.4045.270.
Lough, J. M. (2008), Coral calcification from skeletal records revisited, Mar. Ecol. Prog. Ser., 373, 257–264, https://doi.org/10.3354/meps07398.
Rodgers, K. S., et al. (2021), Rebounds, regresses, and recovery: A 15-year study of the coral reef community at Pila‘a, Kaua‘i after decades of natural and anthropogenic stress events, Mar. Pollut. Bull., 171, 112306, https://doi.org/10.1016/j.marpolbul.2021.112306.
Author Information
Avi Strange and Oliwia Jasnos, Tulane University, New Orleans, La.; Lauren T. Toth, St. Petersburg Coastal and Marine Science Center, U.S. Geological Survey, Fla.; Nancy G. Prouty, Pacific Coastal and Marine Science Center, U.S. Geological Survey, Santa Cruz, Calif.; and Thomas M. DeCarlo ([email protected]), Tulane University, New Orleans, La.
Citation: Strange, A., O. Jasnos, L. T. Toth, N. G. Prouty, and T. M. DeCarlo (2025), A coral core archive designed for transparency and accessibility, Eos, 106, https://doi.org/10.1029/2025EO250226. Published on 20 June 2025.
Text © 2025. The authors. CC BY-NC-ND 3.0
Except where otherwise noted, images are subject to copyright. Any reuse without express permission from the copyright owner is prohibited. -
Early grant success attracts more funding: study of 100,000 applicants hints at why
Nature, Published online: 20 June 2025; doi:10.1038/d41586-025-01952-w
Largest study of its kind explores the ‘Matthew effect’ in research.
-
Blood tests can detect cancer 3 years before diagnosis

Genetic material shed by tumors can be detected in the bloodstream three years prior to cancer diagnosis, according to a study.
Investigators were surprised they could detect cancer-derived mutations in the blood so much earlier, says lead study author Yuxuan Wang, an assistant professor of oncology at the Johns Hopkins University School of Medicine.
“Three years earlier provides time for intervention. The tumors are likely to be much less advanced and more likely to be curable,” Wang says.
To determine how early cancers could be detected prior to clinical signs or symptoms, Wang and colleagues assessed plasma samples that were collected for the Atherosclerosis Risk in Communities (ARIC) study, a large National Institutes of Health-funded study to investigate risk factors for heart attack, stroke, heart failure, and other cardiovascular diseases.
They used highly accurate and sensitive sequencing techniques to analyze blood samples from 26 participants in the ARIC study who were diagnosed with cancer within six months after sample collection, and 26 from similar participants who were not diagnosed with cancer.
At the time of blood sample collection, eight of these 52 participants scored positively on a multicancer early detection (MCED) laboratory test. All eight were diagnosed within four months following blood collection. For six of the eight individuals, investigators also were able to assess additional blood samples collected 3.1–3.5 years prior to diagnosis, and in four of these cases, tumor-derived mutations could also be identified in samples taken at the earlier timepoint.
“This study shows the promise of MCED tests in detecting cancers very early, and sets the benchmark sensitivities required for their success,” says Bert Vogelstein, professor of oncology, co-director of the Ludwig Center at Johns Hopkins, and a senior author on the study.
Adds Nickolas Papadopoulos, professor of oncology, Ludwig Center investigator, and senior author of the study: “Detecting cancers years before their clinical diagnosis could help provide management with a more favorable outcome. Of course, we need to determine the appropriate clinical follow-up after a positive test for such cancers.”
The study appears in Cancer Discovery.
Support for the study came in part from the National Institutes of Health. Additional funding was provided by the Virginia and D.K. Ludwig Fund for Cancer Research, the Commonwealth Fund, the Thomas M Hohman Memorial Cancer Research Fund, The Sol Goldman Sequencing Facility at Johns Hopkins, The Conrad R. Hilton Foundation, the Benjamin Baker Endowment, Swim Across America, Burroughs Wellcome Career Award for Medical Scientists, Conquer Cancer–Fred J. Ansfield, MD, Endowed Young Investigator Award, and The V Foundation for Cancer Research. The Atherosclerosis Risk in Communities study has been funded in whole or in part with federal funds from the National Heart, Lung, and Blood Institute, National Institutes of Health, Department of Health and Human Services.
Source: Johns Hopkins University
The post Blood tests can detect cancer 3 years before diagnosis appeared first on Futurity.
-
Thirdhand smoke is a ‘silent threat’ to kids

A new study finds that parents may underestimate their children’s exposure to environmental tobacco smoke, and a newly identified phenomenon called thirdhand smoke may be to blame.
Thirdhand smoke occurs when chemical residue from smoking lingers in carpets, furniture. and walls long after the cigarette was lit.
Children can inhale these particles by disturbing fabric fibers while playing or ingest them by touching contaminated surfaces and then putting their hands in their mouths.
The study in the Journal of Clinical and Translational Science surveyed caregivers of 162 children in three major US cities. Although 60% says their children had no exposure to environmental tobacco smoke (ETS), urine testing showed that all of the children tested positive for low levels of cotinine, which forms when nicotine is broken down in the body and is a biomarker of tobacco exposure. More than 90% of the children tested positive for intermediate levels of cotinine.
While the study couldn’t conclusively distinguish if the children were exposed to secondhand or thirdhand smoke, the caregiver surveys point to a less obvious source of tobacco smoke exposure, says lead author Katherine McKeon, PhD candidate at Tulane University’s Celia Scott Weatherhead School of Public Health and Tropical Medicine.
“These findings do not imply that the parents are lying but rather speak to the invasive nature of thirdhand smoke and how difficult it is to remove from buildings, cars and furniture,” McKeon says.
“Thirdhand smoke is a newer concept, but ongoing research points to it posing a highly toxic silent threat to children, particularly to children with asthma.”
While exposure to smoking poses a variety of health consequences for all, children with asthma are particularly susceptible, and environmental tobacco smoke can trigger asthma attacks.
The findings also highlight the potential for information bias if researchers rely on caregiver surveys for ETS assessments. While the study found a correlation between high levels of cotinine in asthmatic children and prevalence of asthma attacks, there was no association between caregivers who reported ETS exposure for their children and asthma attacks.
All children in the study were between the ages of 7-12 and lived in federally subsidized public housing in New Orleans, Cincinnati and Boston at the time of the study. Data was collected three times over the course of a year. Caregivers were asked two questions: “Do you or any visitor smoke in your home?” and “Do any household members use tobacco products?”
In recent years, other studies have found evidence that the tobacco smoke residue responsible for thirdhand smoke may become more toxic over time and can be resistant to conventional cleaning methods.
The findings point to a need for more research around thirdhand smoke prevalence and health risks. Additionally, the study underscores a need for alternate methods of assessing children’s exposure to tobacco smoke, such as screening for biomarkers like cotinine.
“Our research confirms that relying on caregiver surveys to assess children’s tobacco smoke exposure is inadequate and leads to significant underreporting due to an underestimated prevalence of ETS,” McKeon says.
“This misclassification may hinder proper asthma management and delay critical interventions.”
Source: Tulane University
The post Thirdhand smoke is a ‘silent threat’ to kids appeared first on Futurity.
-
Team confirms earliest evidence of humans in the Americas
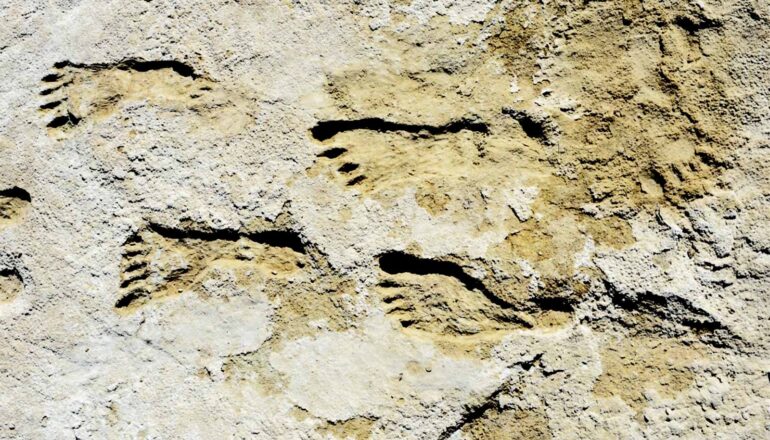
A new study confirms the earliest evidence of humans in the Americas.
Vance Holliday jumped at the invitation to go do geology at New Mexico’s White Sands. The landscape, just west of Alamogordo, looks surreal—endless, rolling dunes of fine beige gypsum, left behind by ancient seas. It’s one of the most unique geologic features in the world.
But a national park protects much of the area’s natural resources, and the US Army uses an adjacent swath as a missile range, making research at White Sands impossible much of the time. So it was an easy call for Holliday, a University of Arizona archaeologist and geologist, to accept an invitation in 2012 to do research in the park. While he was there, he asked, skeptically, if he could look at a site on the missile range.
“Well, next thing I know, there we were on the missile range,” he says.
Holliday and a graduate student spent several days examining geologic layers in trenches, dug by previous researchers, to piece together a timeline for the area. They had no idea that, about 100 yards away, were footprints, preserved in ancient clay and buried under gypsum, that would help spark a wholly new theory about when humans arrived in the Americas.
Researchers from Bournemouth University in the United Kingdom and the US National Park Service excavated those footprints in 2019 and published their paper in 2021. Holliday did not participate in the excavation but became a coauthor after some of his 2012 data helped date the footprints.
The tracks showed human activity in the area occurred between 23,000 and 21,000 years ago—a timeline that would upend anthropologists’ understanding of when cultures developed in North America. It would make the prints about 10,000 years older than remains found 90 years ago at a site near Clovis, New Mexico, which gave its name to an artifact assemblage long understood by archaeologists to represent the earliest known culture in North America. Critics have spent the last four years questioning the 2021 findings, largely arguing that the ancient seeds and pollen in the soil used to date the footprints were unreliable markers.
Now, Holliday leads a new study that supports the 2021 findings—this time relying on ancient mud to radiocarbon date the footprints, not seeds and pollen, and an independent lab to make the analysis.
The paper appears in the journal Science Advances.
Specifically, the new paper finds that the mud is between 20,700 and 22,400 years old—which correlates with the original finding that the footprints are between 21,000 and 23,000 years old. The new study now marks the third type of material—mud in addition to seeds and pollen—used to date the footprints, and by three different labs. Two separate research groups now have a total of 55 consistent radiocarbon dates.
“It’s a remarkably consistent record,” says Holliday, a professor emeritus in the School of Anthropology and geosciences department who has studied the “peopling of the Americas” for nearly 50 years, focusing largely on the Great Plains and the Southwest.
“You get to the point where it’s really hard to explain all this away,” he adds. “As I say in the paper, it would be serendipity in the extreme to have all these dates giving you a consistent picture that’s in error.”
Millennia ago, White Sands was a series of lakes that eventually dried up. Wind erosion piled the gypsum into the dunes that define the area today. The footprints were excavated in the beds of a stream that flowed into one such ancient lake.
“The wind erosion destroyed part of the story, so that part is just gone,” Holliday says. “The rest is buried under the world’s biggest pile of gypsum sand.”
For the latest study, Holliday and Jason Windingstad, a doctoral candidate in environmental science, returned to White Sands in 2022 and 2023 and dug a new series of trenches for a closer look at the geology of the lake beds. Windingstad had worked at White Sands as a consulting geoarchaeologist for other research teams when he agreed to join Holliday’s study.
“It’s a strange feeling when you go out there and look at the footprints and see them in person,” Windingstad says. “You realize that it basically contradicts everything that you’ve been taught about the peopling of North America.”
Holliday acknowledges that the new study doesn’t address a question he’s heard from critics since 2021: Why are there no signs of artifacts or settlements left behind by those who made the footprints?
It’s a fair question, Holliday and Windingstad says, and Holliday still does not have a peer-reviewed answer. Some of the footprints uncovered for the 2021 study were part of trackways that would have taken just a few seconds to walk, Holliday estimates. It’s perfectly reasonable, he says, to assume that hunter-gatherers would be careful not to leave behind any resources in such a short time frame.
“These people live by their artifacts, and they were far away from where they can get replacement material. They’re not just randomly dropping artifacts,” he says. “It’s not logical to me that you’re going to see a debris field.”
Even though he was confident in the 2021 findings to begin with, Holliday says, he’s glad to have more data to support them.
“I really had no doubt from the outset because the dating we had was already consistent,” Holliday says. “We have direct data from the field—and a lot of it now.”
Source: University of Arizona
The post Team confirms earliest evidence of humans in the Americas appeared first on Futurity.
-
Increasing northern wildfires will actually slow climate change

A new study projects that in the next 35 years increasing boreal fires will actually slow global warming by 12% globally and 38% in the Arctic.
Even if you live far from the boreal forests in Canada and Siberia, you’ve likely noticed an increase in smoke from their forest fires. During major blazes in 2023, the smoke oranged the New York sky and drifted as far south as New Orleans.
These blazes have surged in the last decade due to the effects of climate change—warmer summers, less snow cover in the spring, and the loss of sea ice. Experts expect that trend to continue.
Yet recent climate change projection models have not accounted for the increase. For instance, the widely used sixth Coupled Model Intercomparison Project, or CMIP6, released in the late 2010s, kept these fires constant at a relatively low severity.
The new study is the first to identify the divergence between the observed boreal fire increase and the constant fires used in climate models.
Because the aerosols in smoke brighten clouds and reflect sunlight, summer temperatures during fire season drop in northern regions, leading to reduced sea ice loss and cooler winter temperatures. This effect is despite the warming effects of the fires themselves from factors such as soot that falls on the ice.
The researchers published their findings in Proceedings of the National Academy of Sciences.
“This study helps us begin to better project the impacts of climate change. The dramatic increase in these fires in the last years is itself a symptom of that,” says lead author Edward Blanchard-Wrigglesworth, a University of Washington research associate professor of atmospheric and climate science.
“It’s important to remember that these increasing fires still have a lot of negative impacts for human health and for forest biodiversity. And if the fires continue to increase, eventually they could burn through the forests and the trend could reverse. So I wouldn’t say this is good news. But it helps us better understand nature and these trends.”
Every six or seven years, climate modeling centers around the world collaborate to update their projections, using numbers going back to the 19th century and projected numbers through 2100. These data comprise things like wildfires and human-caused carbon emissions. For CMIP6, which was modeled before boreal fires became a clear anomaly, the wildfires were kept constant from 2015 to 2100.
“If you look at the time series of the fires, it starts increasing around 2015, but it really spikes in 2019 and 2021, just as this modeling was being completed,” Blanchard-Wrigglesworth says. “Those are the big years of Siberian fires. And then 2023 was the even bigger Canadian fire season.”
Because climate scientists don’t expect the causes of this increase in fires to abate anytime soon, the team reran one of the CMIP6 models with a new boreal fire projection based on the recent observed trends, resulting in a four-fold increase from 2015 to 2060. This adjusted the modeling for the smoke aerosols. It also accounted for factors like the fires’ soot, which settles on Arctic ice and darkens it, causing it to absorb more heat from sunlight (the same way sun heats asphalt). But the increased reflection of sunlight from aerosols overwhelmed this warming.
While the fires occur only in the summers, researchers actually found a greater cooling effect in the winters, because the fires block some of the summer sun, resulting in thicker Arctic ice that lasts into the following winter.
The study found impacts far from boreal forests. The smoke cools temperatures across all seasons from the Arctic down to the latitude of Northern California at 40 degrees north. The fires also push tropical rains further south because tropical precipitation depends in part on the temperature difference between hemispheres.
The authors say future work should adjust other climate models to account for increasing boreal fires and investigate possible effects of changes in the land after fires.
“I hope our work raises awareness of this issue for further study and of the potential effects of any future human management of these remote fires,” Blanchard-Wrigglesworth says.
“If the increase in boreal fires continues unabated over the next decade or two, society may decide we want to manage boreal fires more. But before we put a lot of resources toward that, we need to try to understand the possible consequences.”
Patricia DeRepentigny, of Université Catholique de Louvain, and Dargan Frierson, a UW associate professor of atmospheric and climate science, are coauthors on this paper.
Funding for this research came from the National Science Foundation and the European Union.
Source: University of Washington
The post Increasing northern wildfires will actually slow climate change appeared first on Futurity.
-
Cannabis use disorder may raise your psychiatric illness risk

New research evaluates the relationship between cannabis use traits and psychiatric disorders.
The results in Nature Mental Health show that cannabis use disorder places people at increased risk of developing several psychiatric disorders, providing beneficial guidance that public health professionals can use to gauge the potential utility of cannabis for their patients.
“Sometimes in the news, you can read an article that says cannabis can benefit mental health disorders, or it can be used to try to mitigate the effects of some other substance use disorders,” says Marco Galimberti, associate research scientist at Yale School of Medicine (YSM) and first author on the study.
“In our study, we show that people who develop cannabis use disorder can actually have a higher risk of developing psychiatric disorders.”
A 2021 report by the National Survey on Drug Use and Health in the United States found that 52.5 million people (aged 12 or older) have used cannabis in their lifetime. And studies have found that an estimated 30% of people who use cannabis have cannabis use disorder, a mental health condition characterized by a problematic pattern of cannabis use that leads to significant impairment or distress.
In the new study, researchers analyzed previously published genome-wide association analyses (GWAS) to examine relationships between cannabis use disorder and psychiatric illness. GWAS datasets are used to identify genetic variations associated with a specific disease or trait by examining millions of genetic markers across the entire genome.
The datasets included in the study addressed cannabis use disorder, cannabis use, and numerous major psychiatric traits. The GWAS datasets informed how genetic variants might relate to disease and the researchers were then able to perform analyses that measured whether and to what degree the genetic risk for one disease or trait affected the genetic risk for another disease or trait.
The researchers uncovered several bidirectional causal relationships, in which not only did having a psychiatric condition put people at greater risk of developing cannabis use disorder, but also having cannabis use disorder put people at greater risk of developing a psychiatric disorder.
Their results supported previous research that identified bidirectional causal relationships between cannabis use disorder and schizophrenia and bipolar disorder. They also, for the first time, established bidirectional relationships between cannabis use disorder and anxiety disorder, major depressive disorder, and post-traumatic stress disorder (PTSD).
“People might suggest cannabis use can be a useful treatment for, say, PTSD, but this analysis indicates otherwise,” says senior author Joel Gelernter, a professor of psychiatry and professor of genetics and of neuroscience at YSM.
“We show that over time, cannabis is more likely to cause PTSD than to treat it. When medications are approved for a particular condition, we generally require strong scientific evidence that the treatment works, but clinical trials are lacking for cannabis for many of these traits.”
The results from this study offer a fact-based approach that public health professionals can use to gauge the potential utility or harm of cannabis use by people with certain mental health disorders, say the researchers.
“With medical marijuana becoming increasingly legalized, many clinicians have been willing to prescribe cannabis for a range of disorders,” says Gelernter.
“Our study shows that this may not be the best practice. We need randomized clinical trials to show whether cannabis works in order for it to be reasonably considered a medication.”
Support for the research came from the National Institutes of Health and Yale University. The content is solely the responsibility of the authors and does not necessarily represent the official views of the National Institutes of Health. The study was also supported by funds from the Department of Veterans Affairs Office of Research and Development.
Source: Yale
The post Cannabis use disorder may raise your psychiatric illness risk appeared first on Futurity.
-
Could Israel's bombing trigger a nuclear accident in Iran?
Attacks on Iran’s nuclear facilities have already triggered at least one internal radiation leak, but should we be concerned that Israeli bombing could cause a larger nuclear accident?